3 Ways to Repurpose that Infographic
Infographics have permeated the web in kudzu-like fashion, and rightfully so. They do a great job of simplifying a complex subject so that it makes sense quickly and easily. We use them in detailing a process, comparing opposing approaches, showing change over time, reporting on surveys, breaking down data, and much more.
To be honest, though, creating a GOOD Infographic is tough.
Quick Tips
- There must be a solid concept.

- The content needs to form a clean narrative.
- The data should be visually appealing.
- The metaphor or theme should be clever, but not cheesy.
- The call-to-action should be forward, but not pushy.
- The brand presence should be present, but not too present.

Whew, and that’s not even getting into the designer’s decisions about which chart type to use: pie, bar, line, flow, Venn, bubble, Gantt, histogram, heat map, scatter plot… the list goes on.
So, once a good Infographic has been created, be sure to get some extra mileage out of it by repurposing it for various social channels and uses. The most popular Infographic shape is the long, skinny 600px wide format that fits so snugly in a blog content column. Just bounce around Visual.ly for a while, and you’ll get the drift.
To add a little more value to the graphic, try these ideas, shapes and formats.
Convert To a Slideshow
A Visual History of Business Intelligence—an Infographic timeline from Information Builders, which was featured in an industry blog called B Eye Network. Once converted to a slideshow, the graphic was also featured as a slideshow at CIO.com.
Financial Regulations—an Infographic from around election time that covers financial regulations. They effectively took the Infographic and turned it into a slideshare presentation.
Is Hosting the Olympics a Win—an Infographic about the Olympics that covered various aspects of hosting the event.
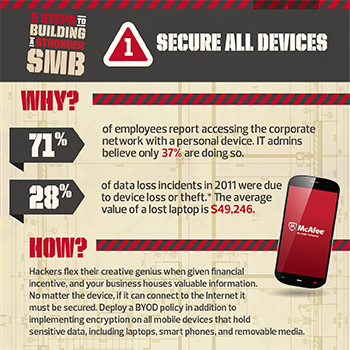
Create Bite-Sized Social Share Graphics
Infographics are full of little nuggets, factoids, and tidbits of information that are prime for sharing on social channels as individual graphics. Think of them as mini, quick-hit Infographics. Posts with images stand out in the sea of one’s feed, so why not rework the Infographic to feed your social content. It can be an isolated statistic. Or an entire Infographic can be broken down into a group of images to be shared as a series over time.


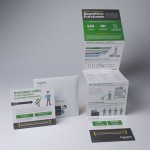
Print Out for Office or Tradeshow Graphics
Do it the old fashioned way: ink on paper! Here are some interesting examples of excellent uses of Infographics in print.


a.com
Brian Compton – Guest Blogger & Creative Director at Lewis PR